
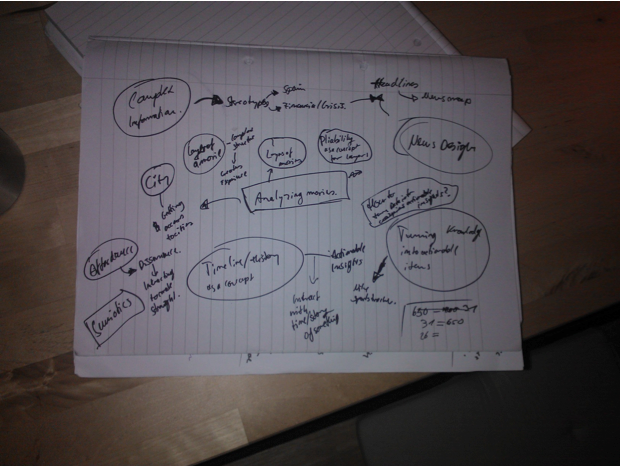
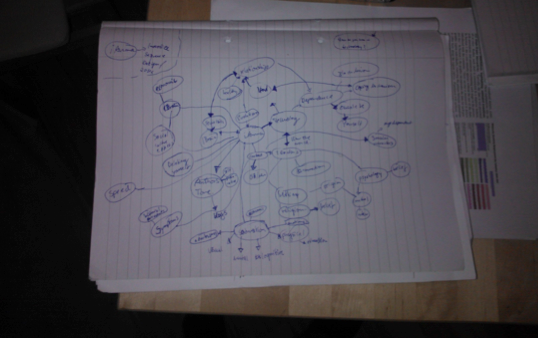
Transcript of all my notebook in order to get some conceptual clarity
Storytelling (based on the article I received from Simone).
When we see bulletpoints on a slide show than a certain part of our brains is activated: The one which turns words into meanings. It is the Brocos area and the so called Wernickes area. And that’s it.
Whenever we hear a story however al parts of our brain will be activated. Also those which usually are only activated when we experience a story.
So basically this means brains can synchronize when people tell a story.
Evolution has weired our brain to work this way.
Recent research has shown that this is to an extend explainable with the discovery of so called mirror neurons.
In a way we can say visualizing data and putting them in a a context is the human face of big and extremely complex data.
Design Research:
I would like to know how interested people are in public data. How do they know about things? Where are they looking for public data and in which context?
Unconscious conclusion:
The unconscious conclusion is a pre-rational mechanism in visual perception which according to Frey who again refers to Helmholtz, follows its own and unchangeable rules.
He lists as an example the sun. It rises and it sets. Even though we know that the earth spins around the sund we will never be able to set ourselves free from this impression as the image is so strong. The reason for this effect is rooted in neurological processing of visual perceptions. A lot of research ahs been done in this direction.
Storyboarding
The visual flow of a narrative is a relatively new concept, but visual storytelling is not. Already cavement use this technique, drawings on walls communicated without motion.
While movies and pictures are linear forms of storytelling, multimedia applications and interactive visualisations are not. A user interacts with the message communicated. And so I can refer to Manuel Lima at this point who worked out the three steps on a way to storytelling with visual data.
Storytelling for Interactive Visualisations
In his introduction Andrew Losowksy states that storytelling is always related to the first visual impression. In Interactive Storytelling however it is not only beauty which engages but alos the interaction as such which can be perceived as beautiful or disrupting. Beautiful Interactions, Motions, animations, contribute tremendeously to successful storytelling.
The visualization is not as important as the story. A story works without and independent from the medium.
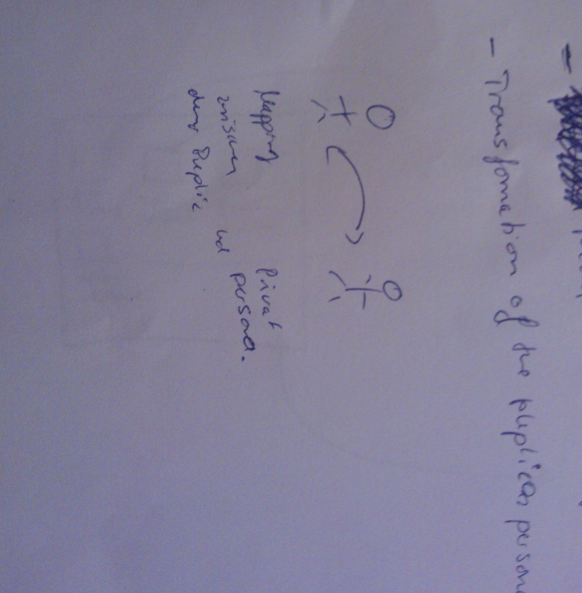
Systems and Networks
Looking at the context and how things interact.
Swarms like birds who fly together
Traffic systems/ the mind/ How we interact with cities who interact like the mind of networks
Bootstrap Theorie (Quantenphysik)
The inner life of a cell, trying to visualize the life of a cell.
http://lockerz.com/u/20851366/decalz/9044832/the_inner_life_of_a_cell
http://www.youtube.com/watch?v=Id2rZS59xSE
If the community is succesfull than the individual will work.
Everything you disturb can have consequences…but in the end when something went wrong you can not say where it came from.
Communication = Exchange of information.
Cognition = processing of information in the brain.
Affordance = Potential for action/ If somebody looks at a design object, will they know what to do with it? Different people will see different things of what to do with it.
BBC documentary: How plants warn each otherà Extended idea of communication.
The more diverse a culture the besser = quite eastern philosophy.
Big data:
- Bio Mimicry
- Case studies for research around a topic
- Catalyst for a major project
- Situations where data can have a transformative effect
Concept of swarming…could it help a human situation?
The whole thing in design is about searching for a problem and solving it.
Critically design a concept which allows a transformative process through technology: Interaction Design/ Transformative quality of data.
–
Forced directed layout and other ways of layouting interactions…
–
Transforming my sensors into a new perception based device.
How to interact with my own body? How to manipulate my body in a way so that it is always relaxed? Turning my body into something I can talk to and at the same time giving awareness of others how they might start interacting with my body and connect it to others.
How to visualize public data?
Usable Data vs. Informative data
Usable= support me in my daily life/ real time
Informative=shape an opinion, long term, elections, etc…
Making sense out of public data is not easy. Considering cognition even less. But how can I critically design an interface with respect to Systems, Cognition and Communication? This is how systems work.
Biomimicry indicates that you look at things a bit closer. What do they mean?
Definition of Interaction Design
Visually communicating prototypes and concepts
Critical Design is defined as “Developing technologies as a kind of commentary on “real human needs”
Metaphors:” Universe”
Topics which cluster together
Zusammenhänge erkennen
Finding peope that fit.
The grasshopper app
Analyse the mood nearby. Whererver there is a good mood you can stay and if you don’t like it you can just jump away to the next place. Don`t deal with people which are annoying, just keep jumping.
Visualization is less about analytics and more about tapping in your emotions.
Globalisation means intercultural communication. Different cultures have signs. Hai from China may understand right away that certain things in the UK work differently. Like the victory sign.
But what is a sign?
Social conventions making meaning within cultural and historical context. With metaphors I can mediate my understanding of a city into another cultural context.
Visualize this
- Big or small visualizations
- Art or slide presentation
Data: There are stories in the bucket
Not just graphs for the news but learn how to repeat data as the news
Art
Visualization is about tapping in your emotions
Interact and explore
Not all movies have to be documentaries and not all visualizations have to be traditional charts and graphs à Sometimes you are not looking for analytical insights
Pattern and relationships: Pattern over time…
From the “interaction design” book
Cognition is what goes on in our heads.
Reading the book about Interaction Design has influenced my thinking on the infographic.
* Typography is very old. It can be found in caves and the alphabet as we know it today is born in the roman empire.
- Generative Design: It is not possible to start from scratch and learn all stuff java. However what I can do is leanring to an extend that allows me to visualize conceots and prototype them. I can take screenshots of any achievement. Achievement can happen in two ways:
- Creating a concept and than computing it
- Take a code and than see what comes out of it
I think the solution is based on a combination of these two.
I need to work on an interface while training my computational and animative skills: Scripting and animation. Animation does play a big role in my work. Aninmation and Interaction.
Information gestaltet man nicht einfach nur mit Code. Everything matters (Bruce Man).
Network visualisations: Disproportional belief in the trust worthiness of certain maps.
Network visualization can learn a lot from cartography. As an exemplary case of harmoniously combining science, aesthetics and technical aspects.
In the beginning there was a treeà 2.1
Lima proposes to put information visualization in the context of already existing fields of domains in Science, Design and Art.
Science is the area which defines how to generate knowledge. But information visualization also involves designers in order to allow the user to discover patterns. The designer creates visual layouts, supports the user in doing so.
Art à Non-utilitarian activity.
Design à Ulitiarian.
Lima refers to Pollock whos says that the tree has grown into a kind of organizing principle for our human efforts to understand the world.
The end of an era:
The tree model is still implemented in many interfaces but it doesn’t (according to Lima) reflect the interconnectedness of a modern society.
* From trees to networks: If you visualize information with the help of a tree than it will, according to Lima, never really embrace multiplicity.
02: From trees to networks:
01. Planning a city—A city is not a tree
02. Neural landscapes: Brain as complex systems
03. Ubiquitous Datasphere: Interconnectedness of data
04. Social collaboration: Stratification of Society
05. Classyfing Information
06. Ordering nature
07. Network Thinking
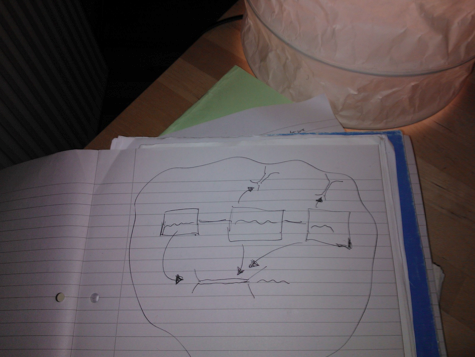
03: Decoding Networks
Layers
1. Semiotics: Study of signs and sign systems/ Umberto Ecco
Metaphors
Affordances
Bid tree
2. Metaphors
Understanding one thing in terms of another
3. Affordances
4. Natural mapping, Feeback, Constraints
Complex Layering in terms of different meanings/ invite someone to discover layers
Selbst-evaluation im Februar.
Was habe ich gemacht?
Ich habe zwei Texte geschrieben: der zweite Beginn der Thesis ist also auch schon angefangen.
Um mein konzeptionelles Verständnis zu schärfen habe ich recherchiert.
Ich habe die idee der gemappten Idee entworfen, was dann zur Public Persona geführt hat, die auf Schritt und tritt beobachtet wird.
Ich habe alle Gedanken hier in diesem Buch gesammelt, also alle meine Sketches, mein brainstorming, das gehört ja zusammen.
Ich habe mich in den Processing Code eingearbeitet.
Viele Ideen und Recherchen habe ich auch in meinem Blog zusammengefasst.
Bisherige Forschung:
- InfoDesign, im Speziellen Typographie
- Java Script
- Flash
- Concept and Performance
Moritz Stefaner hat erst Dokumenten maps visualisert udn hat dann Tag clouds verwendet. Ich habe aber Tag clouds aus einem komplett anderen Winkel beobachtet und schon damals anders dargestellt als er.
Bei mir war die Visualisierung von Handlung, also Social awareness, anders fokussiert. Das kann man auf aggregierte Daten übertragen.
Wahlergebnisse sind zum Beispiel solche Daten.
Informotion könnte zum Beispiel ein Schritt in diese Richtung sein, wo zum Beispiel Daten über Zeit visualisiert werden.
Aber irgendwie funktioniert das auch nicht mit dme Irgendwie.
Die Original-idee war die visualiserung von Echzteit daten, sogenannte social awareness daten.
Jetzt geht es darum diese daten weiter zu explorieren damit man Erkenntnisse gewinnen kann. Der Erkenntnisgewinn ist sehr wichtig, obwohl ich es nicht als Rolle des Designers sehe, diesen Unbedingt zu erbringen. Es gibt ausgebildete Sozialwissenschaftler für soetwas.
Mapping Social Data and unveil Stories. Creating these stories and making things possible. Open up.
- Mapping Social behavior generated from Search engines Queries.
- Mapping emotions. Mapping emotions of and about an issue.
- Mapping emotions with twitter.
- Mapping emotions with bing.
- Mapping emotions from networks.
- Combining mapped emotions.
Implicit data, match behavior. Stay with your idea of mapping emotions.
Wie kann man aggregierte Daten darstellen? Wie kann man daraus Geschichten erstellen, mit diesen aggregierten Daten? Wie kann man solche trockenen Daten aus sozialem Verhalten mit Leben füllen? Wie kann man semantische Aspekte einfliessen lassen?
Tools for storytelling with linked data.
Visual Mapping of computer mediated communication.
Who is talking about a topic? Grabage can model.
By adding simple filter mechanism, we start telling stories.
Also by highlighting such data.
Aggregated behavior, simplification.
Interaction Techniques for mapped social behavior> Narrative Structure.
Mapping behavior and interacting with it, eventually even my own behavior.
Visually communicating behavior with maps.
Carolina Melis…
Be real, be honest, be smart, be fun… !
Storyboarding
Storyboarding techniques:
* Differentiate between the storyboard and the final storyboard.
* Rough and pencil
* Six feet under
- Series of pictures and events, contextual transitions
- Fast flowing or short, dissolver, try to have a teaser.
- How are elements structured and composed?
- Timing, sound, visual sync to sound.
- Text transitions/ Scene transitions/ Scale
- James Bond: Set in 62
Narrative Constructs
- Technology in New Media
- Construct a narrative with Media
- Network Communications: How does it change our way in Interaction with new media?
Story and narrative: Related but not the same
- Narratives Elements in Art
- What is the creative intend?
- What is the tone of mood?
- Narratives in Books: Linear or Non Linear?
- Narratives in Film: Lola rennt, breaks the linear scenario with very fast cuts
Timecode, another example
Narrative in New Media/ Interactive Media
Cuervo 2003
Wheather it is active or not, it remains an active participation on the part of the reader.
The machine is using us
Deepsites.maxbrinsma.nl
Natural User Interfaces
Philosophical aspects of Design
Digital Visual Cultures
A while ago I wrote:
I don`t know what to do with my knowledge base, will it be one or two documents? How do I collect stuff?
Why do I collect stuff and in which way with which questions? Putting it in a word document is different from collecting sketches and I put in an Indesign file.
Less complicated.
On the other hand putting it on the website with time stamps wasn`t a bad thing either, cause I might have built it on top of it? But than again it is all complicated…
- 1. Just collecting
- 2. Creating a technical baseline and building on top of it
- 3. Collecting and making a nice Flash animation
Notes from Visual storytelling book:
Where are my friends right now? What they doing right now? We also intimate our behaviour to others, without being aware of it. Looking at my friends is like…
Design is not only about making things simple…it is about innovation, stimulation and creating a satisfying and provocative solution.
“the lates software offers a dazzling amount of tools to give shape and meaning to a massive amount of data. We have to be careful that a tool doesn not become the message, and that we still allow the possibility to point us to new ways of thinking (p.59, Visual Storytelling).
Otto Neurath, Gerd Arntz, Steve Duenes, Nicholas Felton (who re-defines the borders of personal and public personae).
Metaphorical expressions in everyday language can give us insight into metaphorical nature of concepts that structure our everyday activities.
à Metapher kommt vom griechischen Metahphora
à Die Schreibtisch-metaphor ist der Versuch, eine bekannte Ordnungstruktur auf eine Umgebung zu Übertragen, die wir noch nicht kennen. Laut Mortiz Stephaner sind die Zeiten, in denen man das machen musste aber vorbei, denn neue Mediennutzer heute müssen das angeblich nicht mehr, da sie neue Interaktionen lernen können.
Visualising data/ Information Mapping
Schaffung von Gebrauchswert
Darstellung von Zuständen à Information desgn dient der Inszenierung der Daten / Stapelkamp, p.360
Redefine the borders of our personal and public persona.
Transformation of the public persona defined by behaviour.
Geschichten in der Globalen Polis gegenüber den Geschichten im hier und jetzt
Mapping outside the frame…Interactive and locative Art Environments
Examples:
à Influences of artists, images, texts
Theorethical text
à Back up yourself
About section: CogSci, …
Allowing people to preproduce what you have done?!
Sketches…sketchbook can be integrated.
Examiner…make it offline.
Videos.
The language of the Global Polis
Urban Planning discussions
à Centralization vs. de-centralization
à Top-down vs. Bottom-up
à Collectivism vs. the capitalist city
à Today we find out that city planning is far more philosophically than historians are willing to admit.
à Self-help based urbanism
à Planning spontaneity in the modern metropolis
The industrialized metropolis, Neuraths theorized, suffered form the fact that it thrives on the de-humanization of the worker.
DEMOCRATIZE AND DECENTRALIZE KNOWLEDGE IN THE CITY
à Sprung von der Polis zu modernen Ontologien und Ontologie-visualisierung unter dem Aspekt des Geschichtenerzählens.
Design around storytelling.
Scenarios, lifestyles, these are all stories. How to discover stories of other people? How can public data be foucssed around my life story?
Focus on data exploration
Focus on exploring interaction of narrative visualization of publicly available data driven by the user including data of the public personae in the real time data polis.
I want to drive a case study of a true user story about myself, designing around this story, verifying it and generating ideas on how the user is getting access of his own data was possible and to what extend I want to share these data with others. Where lies the danger in this? I am not focusing on the coporations in this case. …
For example interactive visualisations allow users to manipulate the display, introducing design decisions that do not apply to non-interactive media.
Which balance do we need in the combination between author- and reader driven experiences to allow making sense out of public data and to minimize the distortion and manipulation of the thruth. Was it mit der wahrnehmung? Mindful relection of emotions?
à Not loos the aspect of randomness…
The global polis
Urban planning of the global polis
Central vs. decentral
Top down vs. bottom up
Otto Neurath did not believe in these two.
Stadtplanung involves philosophical aspects and they are far more complicated than expected in his eyes.
Neurath believes in sel-help urbanism or participatory urban planning.
This involves planning spontaneity in the modern metropolis. Ordererd disorder.
“How can you re-concile modernity (Modernism) and community (informal planning)? ”
à Improve the ability of Vienna to communicate with its citizens.
à New approach to knowledge management, visual communication and information design.
“How can you re-concile modernity (Modernism) and community (informal planning)? ”= Organized self-help
Otto Neuraths Understanding of Democracy
Being able to understand complex information in the coffee break.
2D graphics with concrete guidelines. Isotype and Gerd Arndtz.
Neurath was acutely aware of the way in which habit conditioned how we absorb knowledge.
Kleiner block
The role of distortion as a concept to gain understanding of Sensory Interaction
Distortion strengthens in a way our understanding of sensory perception and it can help also to understand how perception is mediated.
We focused on locations which have a perceptual and affective impact and we choose the creative recoding technique as a constraint.
We decided to capture the world in a matrix, basically a low resolution sensory by painting with pixels.
We decided that with these pixels we do not necessarily capture a picture but a personal perception which we can mediate. The encoding of the perception happens also in the pixels.
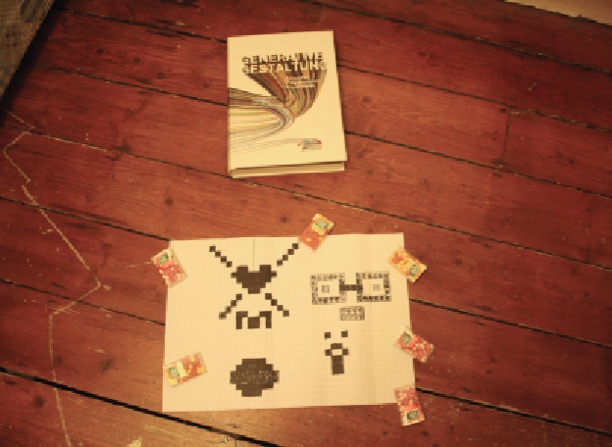
First results were terrible! Once we understood: We can not reproduce the world this way: We have to focus on the essentials: Making hierarchies, it actually worked. The grid just doesn`t allow any details.
So this little distortion in the non –digital recording made us understand how to analyze experiences.
So as a next step we wondered how can we now mediate this experience: how do we enable other people to decode this?
So this grid immediately made us think in the direction of a haptical interface, where pixels came out.
Or an olfactory one: Even people who cant see can taste.
This brought us to the idea to think of how we can elaborate the distortion concept further.
So in digitalizing the image we had this idea of a mechanical street organ which doesn`t make the sound you intend it to make.
What we learned is that in certain environments and for certain people it may not be possible to mediate an experience and make it relievable.
Mapping an experience and transforming it in the world of others.
In fact: When thinking about synesthesia we realized that this affects a lot of us.
Mirror neuron
Now those of you who read the “Emerging Mind” lecture will understand why these are numbers: Some people see numbers in colors.
Mapping certain sounds to shapes.
Synesthesia shapes us.
Visual Storytelling
Contextualizing Information
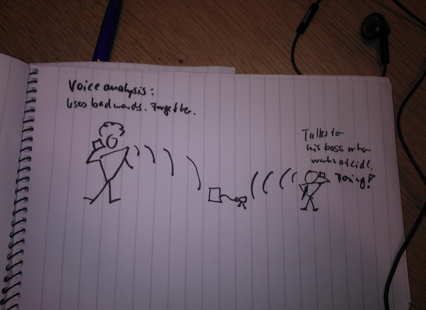
When we see bullet points on a slide than a certain part of the brain gets activated which turns words into meaning. Brocos area and the Wernickes area: and that’s it. Nothing else happens.
When we hear a story however all parts get activated….also those which are ususally activated when we experience the story.
If someone tells us about the decisions certain foods were, our sensory cortex lights up.
Brains can synchronize when people tell stories. Evolution has weired brains for storytelling…how to make use of it.
Long story short: A story, if broken down into the simplest form, is a connection of cause and effect. Exactly how we think. “Personal stories and gossip make up 65% of our conversations”.
Telling stories with data….Movie directior + Simones comment on Encoding.
Visual Data stories: Human Face of Big Data
Collecting visualisations with narrative components and than attempt to identify and categorize the design features that effectively tell stories with data.
- Primary source: Online Jorunalism, including visualisations produced by the New York Times, the Guardian, the Financial Times, the Washington post and Slate: Analysiere die Narratives und interaktiven Geräte, die in den Beispielen genutzt weren. Die akkumulierten Daten ergeben wiederkehrende Muster, die zu einer Analyse führen.
Mapping data and still telling stories
There are not many people who have written a lot about data visualization and storytelling.
While a story is usually linear, it becomes branched in digital, interactive stories.
Doing an intensive research which extracts patterns and applies them to a design example of mapped data.
Behind the frontline/ Afghanistan.: Business, Journalism und Visualiserungsforschung.
If you make short notice plans to go out/ meet friends without long planning. . . How do you do that?
What do you do, if you have the feeling you`re wasting your time?
Concepts we live by….
Metaphor= Advice of peotic imagination. Argument as war/ Argument as a dance?
The essence of a metaphor is understanding and experiencing one kind of a thing in terms of another.
Human purpose typically requires as to impose artificial boundaries.
The data-driven life
The big data which decide on life. Wouldn`t it be great if we could do something with these data. Don`t they belong to us? Aren`t they ours? How can we make sense of them? How can we let users explore them?
à Sensemaking of Big Data
Exploring the big data and making sense of it.
Exploring big data visually. My aim is to spread data literacy through the world and also where the danger lies in this.
Task: Think of a question you would like to be answered with data.
Visual Exploration for the big data:
Es gibt ja jetzt drei Möglichkeiten, wie wir diese Sache angehen können.
- Wir nehmen einen Datensatz, kombinieren ihn mit einem weiteren und erhalten eine interactive Visualisierung, welche den User zum explorieren einlädt. à mit eigenen netzwerk datan + public transport.
Generating Design Maximes for BIG DATA. Putting myself as a layer on top of other data.
Mapping Social Data in the Big Data
Ontologien bieten den meisten Ansatz im Moment, weil sie einen sehr wissenschaftlichen Ansatz beschreiben.
Aber es geht nicht nur darum, ich will ja auch wirklich etwas gute szeigen. Strukturiert denken und arbeiten, etwas in Gang setzen, mich selbst weiterzuentwickeln.
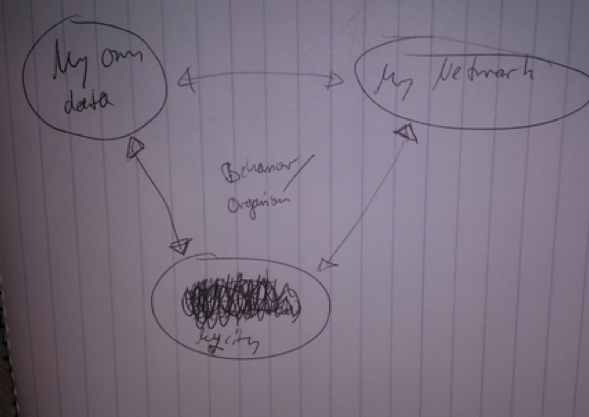
Mein Netzwerk, mein Verhalten.
Das Netzwerk anderer, deren Verhalten.
Die ganze Stadt, das Land, deren Verhalten.
Wie mache ich das Verhalten einer ganzen Stadt sichtbat? Wie stelle ich dies meinem eigenen Verhalten gegenüber und was lerne ich daraus..
A data interface which reflects my thoughts on sensemaking of big data, storytelling and the future.
Thinking in layers was very helpful for me. The layer concept, especially the emotional side of it is very useful. So how can we introduce an emotional layer in a big set of data.
How can I understand my digital self better and compare it with the environment?
Computer-mediated communication.
Why is social awareness good in order to support dealing with big data.
Data visualization can contribute to make sense out of big data, especially when dealing with publicly available data. Why shouldn`t we be able to use publicly available data? Why shouldn`t we be able to use publicly available data, as we generate a big part of it ourselves. This starts with simple examples, like the oyster card. We can use the data of the oyster card as an example for an area in life which got modified by digital aspects.
But what has it o do with social awareness or community mirrors and how is it related to organic and computational information design?
Mein erster Ansatz war Social datane zu visualiesieren, mein zweiter Ansatz war diese sozialen Daten mit Aktivität zu verbinden, also mit Big Data.
Die Awareness kommt man durch Aktivität, we macht gerade Ähnliches wie ich?
Ich leihe mir Gedanken von Organic Information Design, Computational Information Design und versuche dann aber auch wieder zu abstrahieren und zwar Maxime für die Gestaltung von persönlichen Daten-Interfaces im Kontext von Big Datas/ Experiments als Fallstudien. à Visualiserung eines Networks in Verbindung mit bestimmten Daten und die weitere Abstraktion hin zu Traffic Daten im größeren Kontext.
Pirat Box/ Share Box
Self organizing group over time and space.
Free Wifi .
Community of Interest.
Embodiement of the digital life. You have to go there. Physicality of information.
How can I connect online with such offline networks?
Greater Brighton
Network for a festival.
Bringing the network to everywhere.
It is about how we can make sense out of complex data. Which concerns do visual impressions play in this context and how can we visualize these data in a meaningful way?
My data, my friends data, the city, live in society I live in, the world?
How are these social entities interconnected and how can this interconnectedness be used by various audiences to support life and make data production more democratic? My goal is to conduct various experiements for each singe entity and to create a hypothesis for future and present interfaces in big data, especially real-time environments. Each single one of these experiments shall focus on the visual aesthetic of interaction and experiment with paradigms.
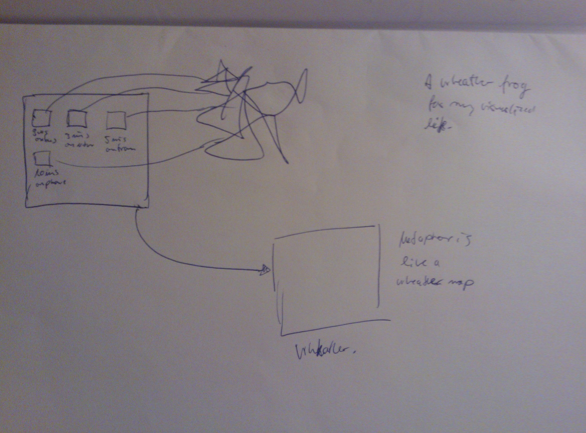
SWARM BEHAVIOR OF THE GRASSHOPPER
This project was inspired by the swarm behavior of the grasshopper and is related to it.
The grasshopper and its swarm behavior inspired me to design a data interface which displays the most interesting place to be when analyzing my data.
This behavior is similar to the ones of birds and can have certain aesthetics just by watching it. Compared to birds however the grasshoppers land on the same place. Grasshoppers show this behaviour only if the yget close to the each other. If the grasshopper spends a certain time by itself it relaxes, changes its behaviour and begins to metamophorical process once its population is overdensed, it starts metamorphing againg in terms of black and than it jumps away again.
Arent humans a little bit similar. Don`t we start to get nervous if we hear about all the things our friends do? Aren`t we totally nervous if we don`t check our mails daily? And while this feeling completely makes us crazy in the first day of vacations, we actually start to relax after having spent a few days on the beah and than we suddenly feel we don’t need this anymore.
While my initial idea was to design an application which was meant to help us to transform in a normal mental state which helps the user to remain calm and relaxed and not get nervous when being overloaded with information.
A research on this topic showed me that wuite a lot of work is being done and I came to the conclusion that it might be to late… Arent we already in the state where we just are overloaded with opportunities and can we not simplify to solve this problem by learning the data space and deciding to move to a calmer place. As the author of this comment I can report such a step.
Now there are certainly many opportunities, but they are less connected with my social network So I don`t need the follow these and I can concentrate on my actual work. Once we are however in an environment which are involved in we have to deal with all our communities, options and always thinking of …
MAYBE NOT MISSING THE BEST OPTION?
The potential risk and opportunity of an interface which tells whether we are or not on the right spot or not.
Grasshopper + birds
Google Now
Design: Final Interface, what is the interface about?
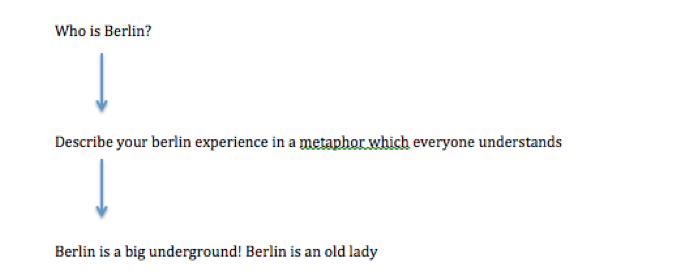
The idea of this project was to analyze the role which metaphors can play to communicate perceptions in multicultural environments. While I didn`t find an answer to this question I want to propose a design which could help analyzing this topic.
People telling little stories about London and comparing it with something else.
As Lakoff says, a metaphor to describe one thing with another. These stories can be understood as layers which unveil the different aspects which shape an interperception. By merging these layers into a single word or visually speaking, a single image, we have to hope that this sign is decoded in the same way, in order to convey our perception.
The assumption is, that certain metaphors are easier understood in intercultural contexts.
If we say, London is like the little sister of paris than we all have an idea of family relationships. But small in England might be differently perceived than in Tibet. With the idea of “what is London…?” I want to propose an idea of how we can compare perceptions. In a way, this might be the inspiration for future psychological studies in this field, comparing these stories and the signs being used to an extend to understand which metaphors are understood and perceived internationally and can help us to communicate percpetions and allow people to see things with the perceptions of others, despite cultural distortions.
Sensory Interactions
Once we captured sensations, we have to try to understand it ourselves. What exactly defines a perception around us? Is it the light, the noise?
Georg Simmel
“Der Wiederstand des Subjektes, in einem gesellschaftlich-technischen Mechanismus nivelliert und verbraucht zu werden”
“Ein Präservativ des sujektiven Lebens gegen die Vergewaltigung der Großstadt”
Georg Simmel, p.105
Der Mensch ist ein Unterschiedswesen, d.h. sein Bewusstsein wird durch den Unterschied des Augeblicklichen Eindrucks gegen den vorhergehenden angeregt, beharrene Eindrücke, Geringfügigkeit und ihre Differenzen, gewohnte Regelmäßigkeit ihres Ablaufs und ihre Gegensätze verbanden sozusagen weniger Bewusstsein, dals die rasche Zusammendrängung wechselnder Bilder.
à Die Verantwortheit sich aufdrängernder Impressionen.
Verbraucht uns, vergewaltigt uns.
Der Verstand ist die Oberste Schicht unserer Seele, er ist die anpassungsfähigste unserer inneren Kräfte. Er bedarf nicht der Erschütterung und des innernen Umgrabens und durch allem das konservative Gemüt sich in den gleichen Rhytmus der Erscheinung zu schicken zu müssen = Schutzorgan gegen innere Entwurzelung.
London war nie das Herz von England, oft aber sein Verstand und immer sein Geldbeutel.
So zwingen ihn auch harmlose Eindrücke durch die Rascheit und Gegensätzlichkeit ihres inneren Wechsels so gewaltsame Antworten ab, reißen sie so brutal hin und her, dass sie ihre letzte Kraftreserve vergeben und im gleichen Millieu verbleibend keine Zeit haben, eine neue zu sammeln.
Entindividualisierende Kleinstadt. Köperliche Nähe. Durch überwuchernde Kultur is das Individuum weniger und weniger gewachsen.