
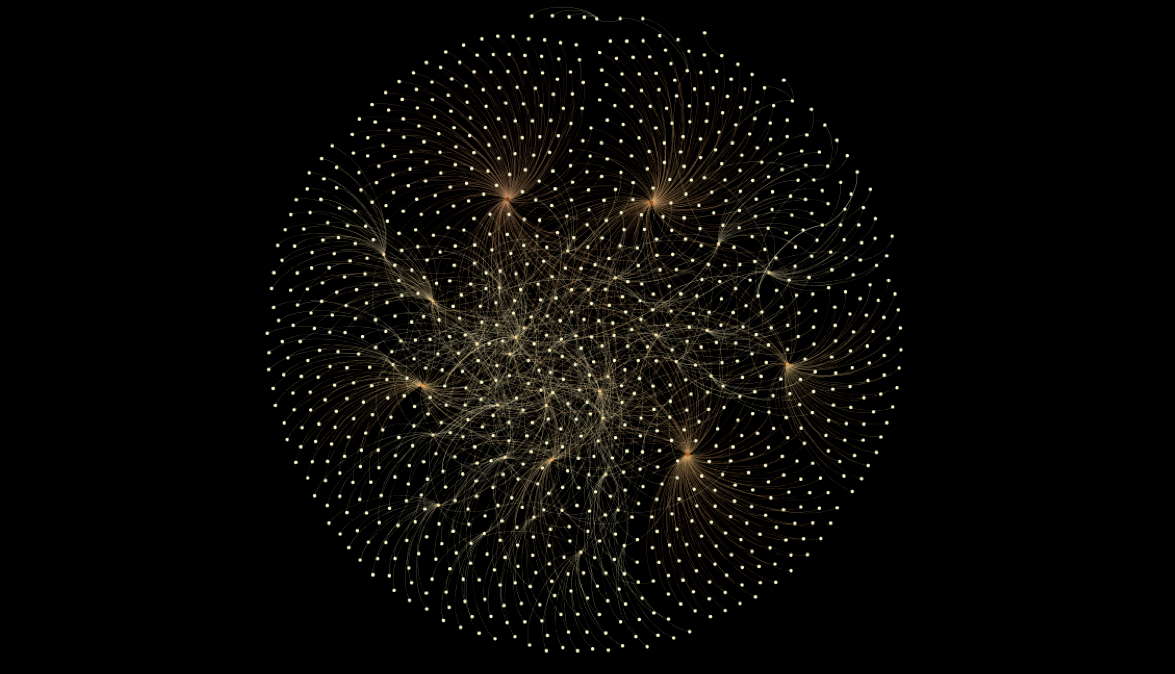
My design problem led me to a series of experiments and explorations involving a variety of technologies, like Processing, Flash/Edge Animate/ After Effects, as tools for visual prototyping to draw user scenarios and Gephi, a very specific open source tool for data visualisation.
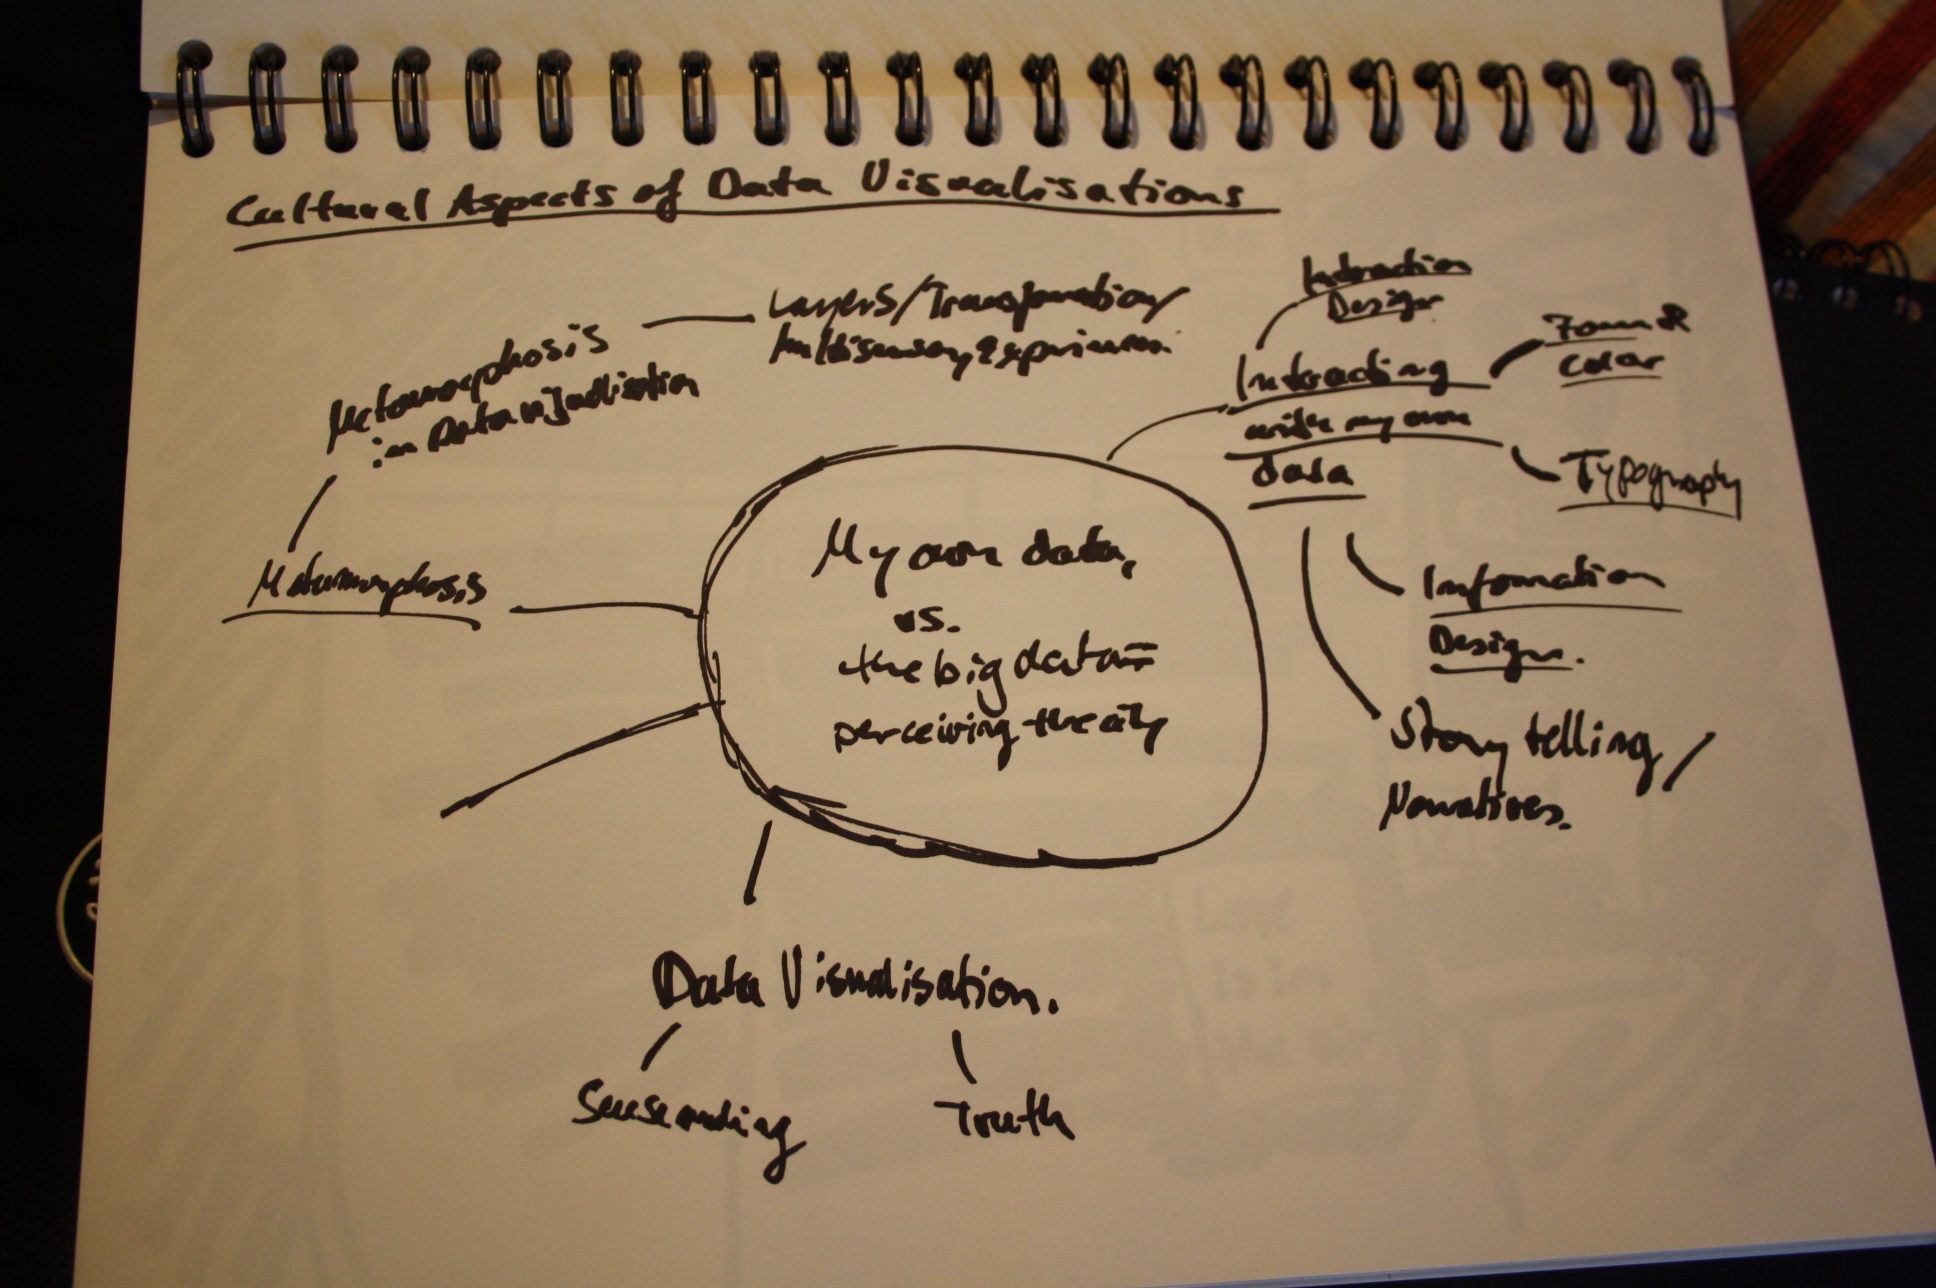
Data visualisation is not always about analytical insights. Not all movies have to be documentaries and not all visualisations have to be traditional charts and graphs. Data visualisation can also be about tapping in your emotions, via Interaction and exploration, and about involving you by transforming information into experiences. But are these emotions created by designer`s reality or subjective views of its creators?

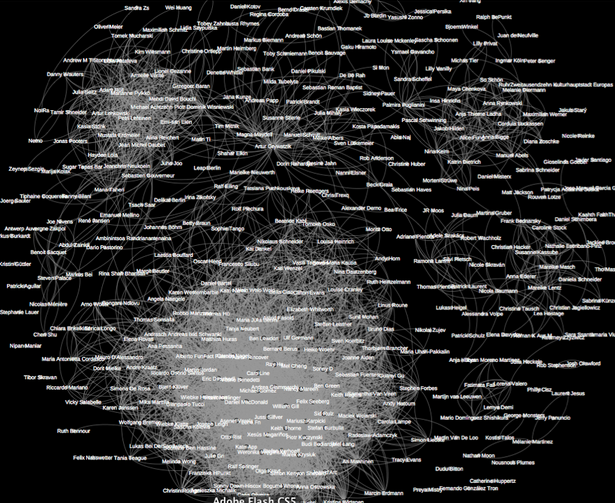
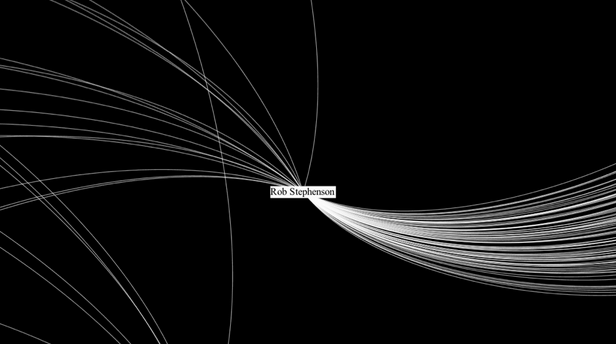
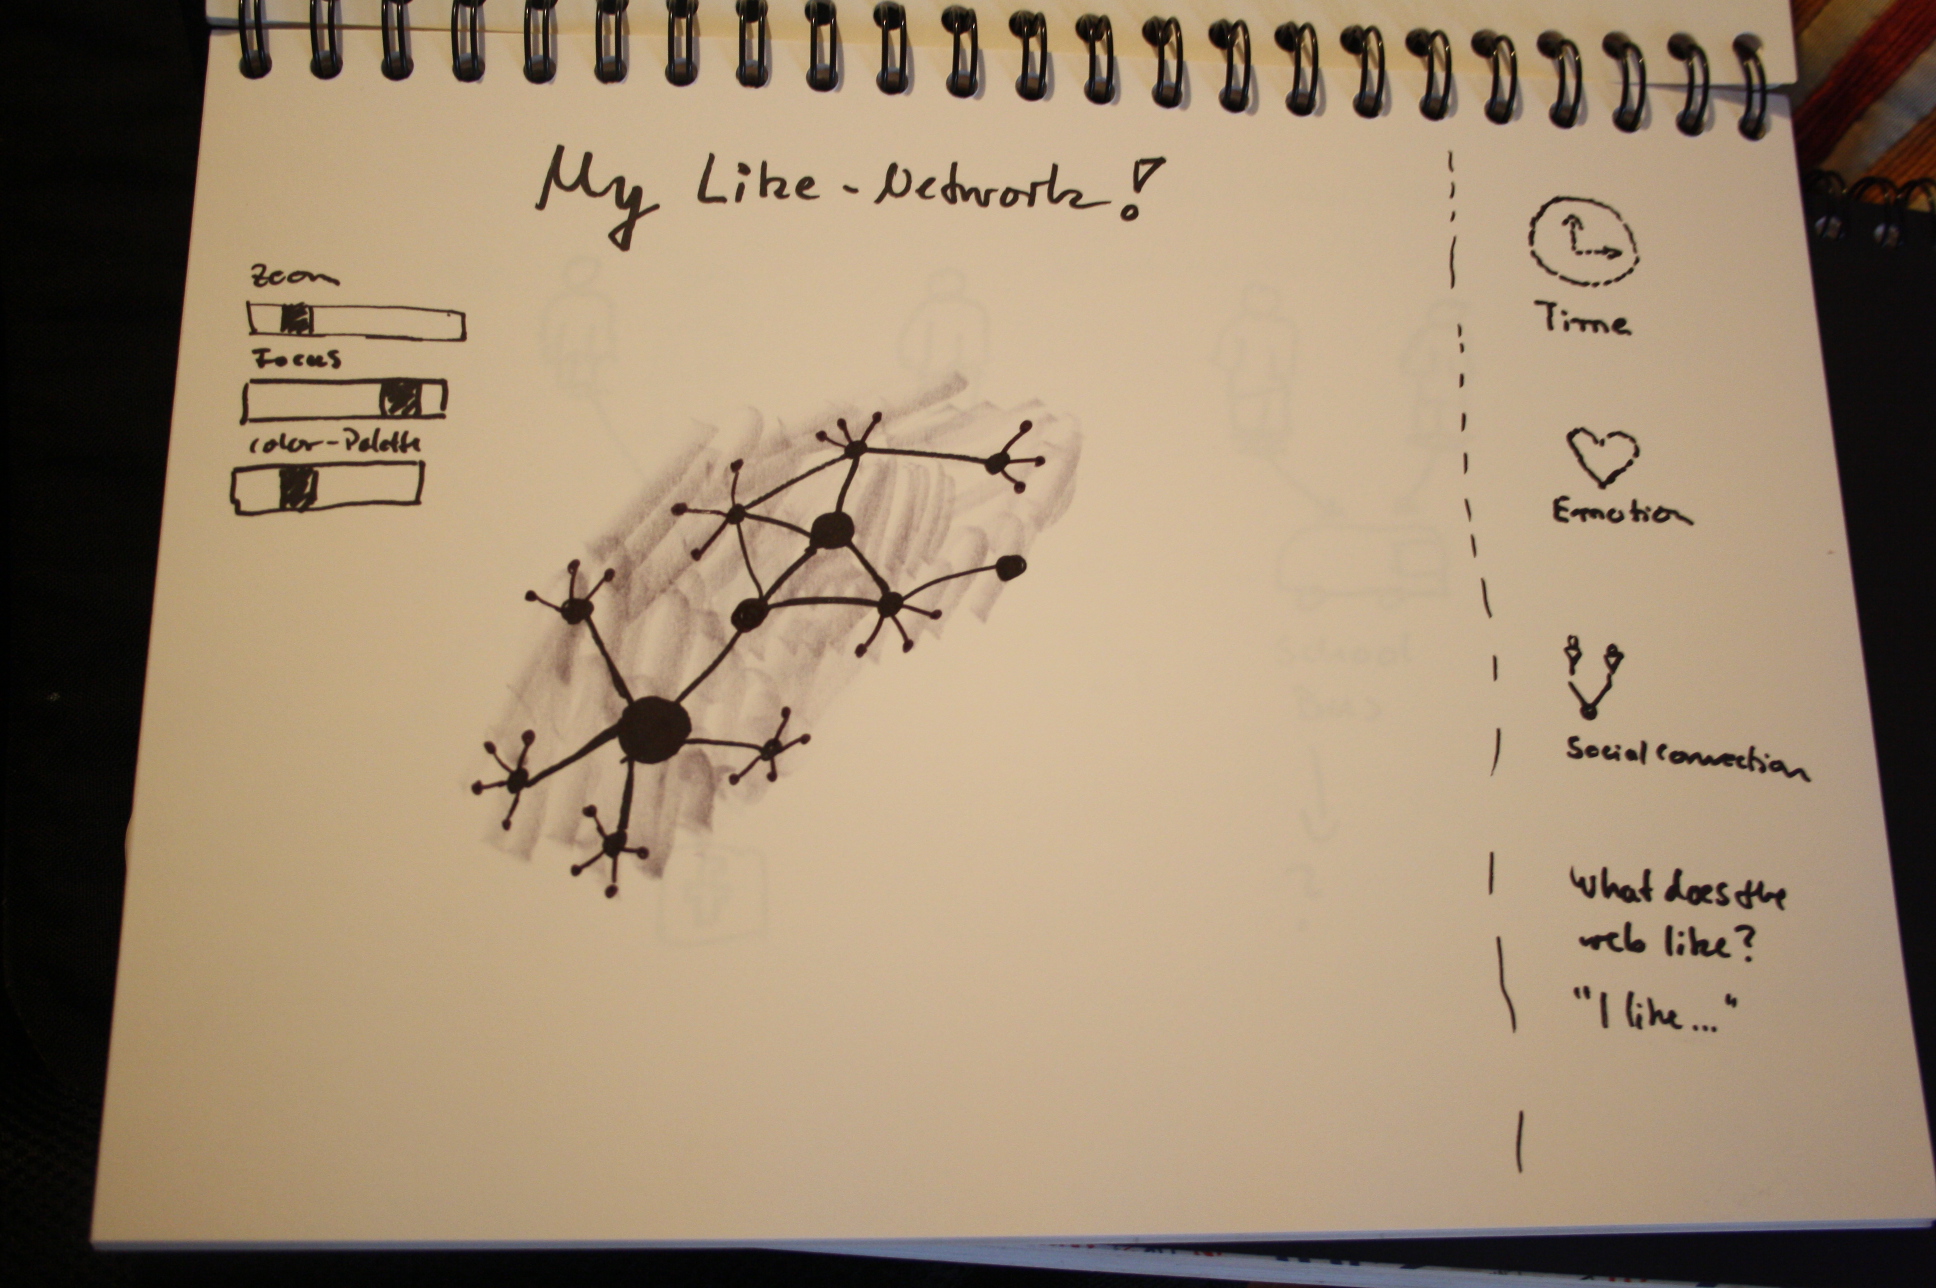
If we zoom into my like network for example we will see, that no one in my social network “likes” as much as Rob does. But is this true? What does it say about Rob? Making sense out of data in such a way is a very subjective approach. In this case my framing transforms Robs image.
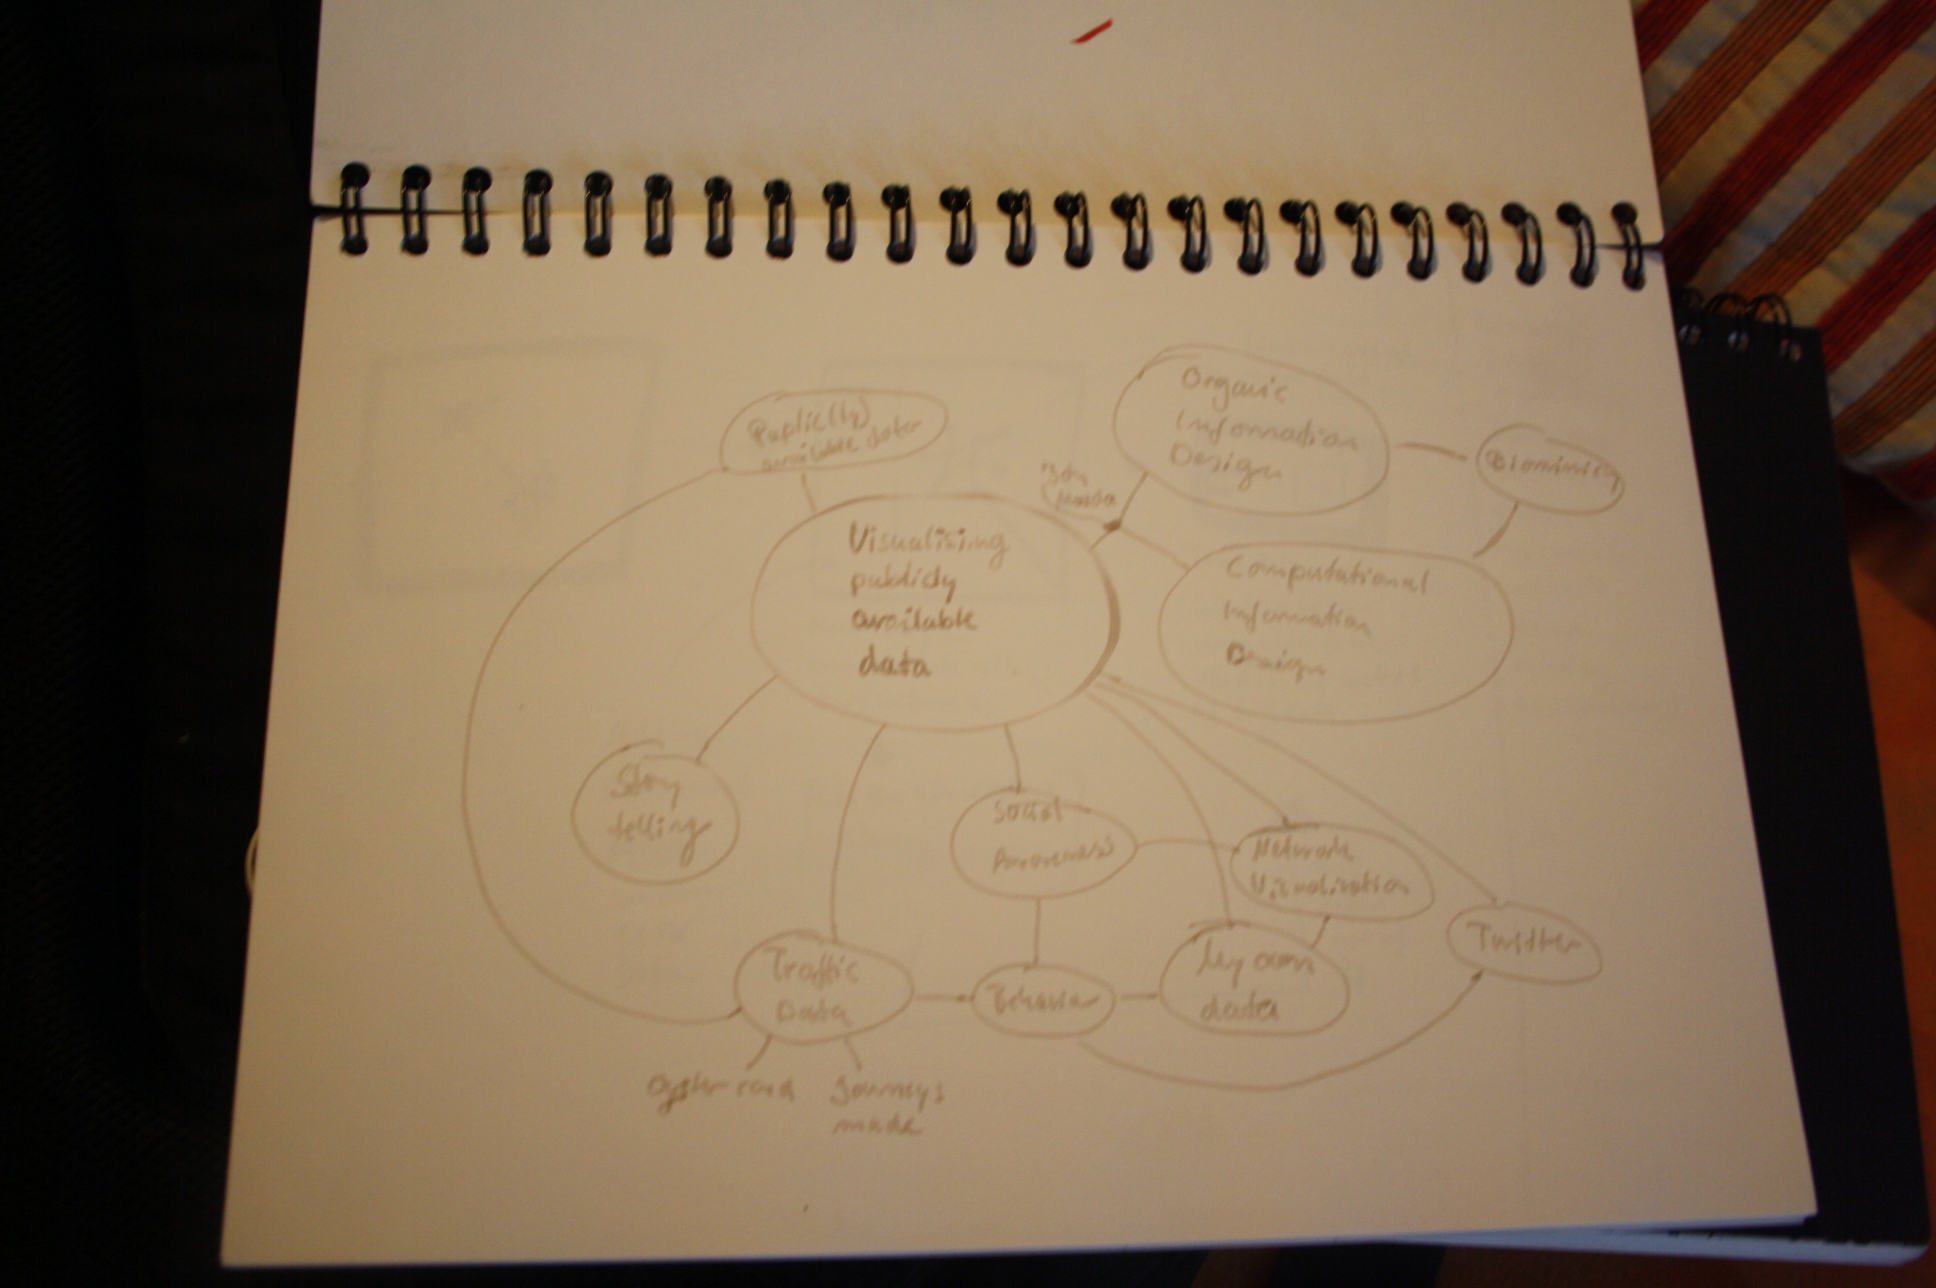
This process was a very important exercise as it was the starting point of thinking about my own mapped digital identity and I started to create first ideas around the digital-self. Especially as certain data sets were not at all accessible at all or it was not possible to visualise them in a simple way with Gephi as the standards of the data set were too specific. I started to wonder how a modern democracy can work if people who create data can not analyse them, even with advanced technical skills?
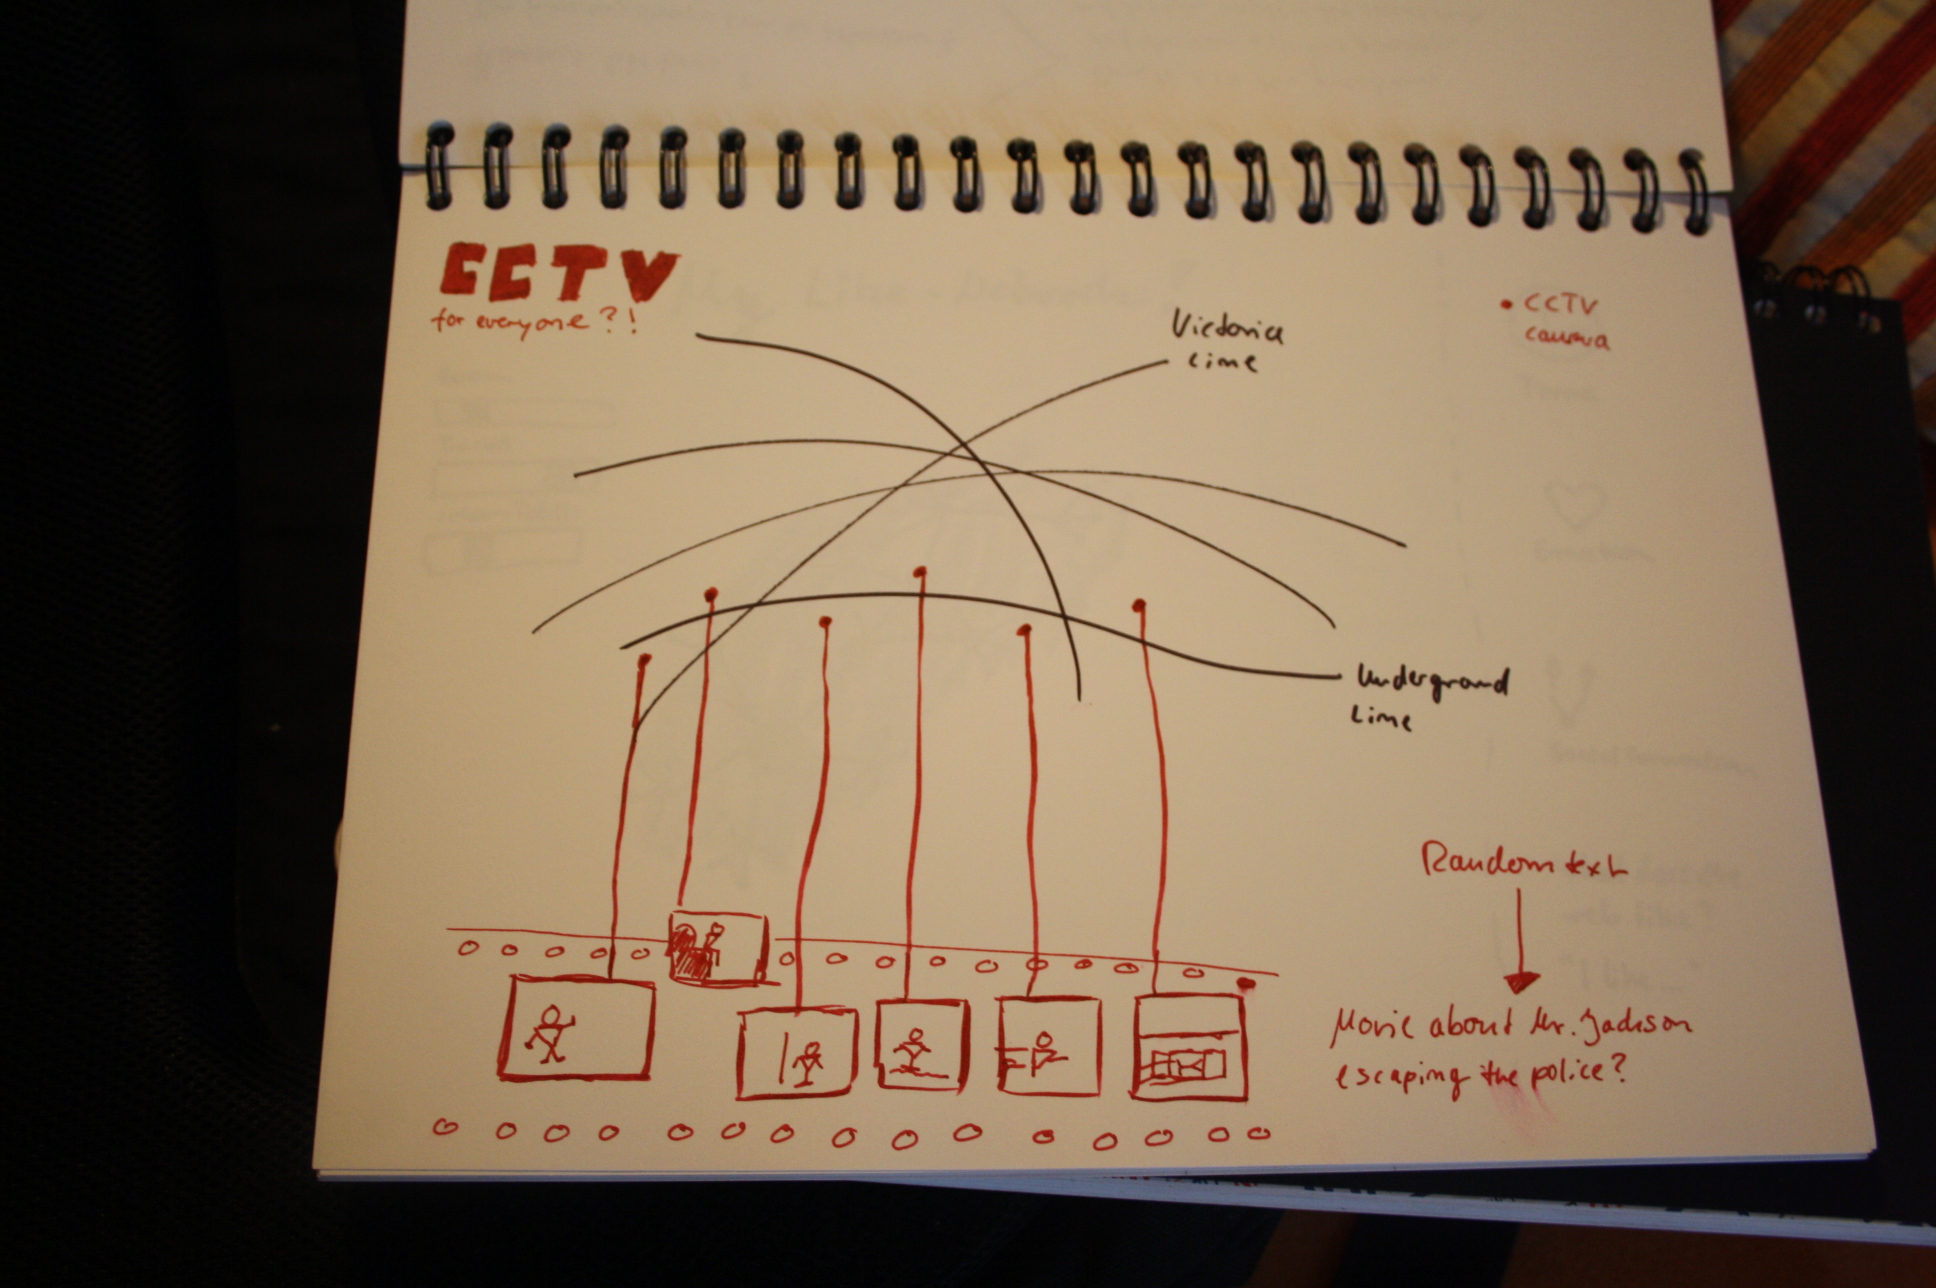
In this general approach first ideas were generated, e.g. the concept of de-contextualising random cctv-movies of single people filmed in the streets of London and weaving a fake automatically generated story around those.
and many more…
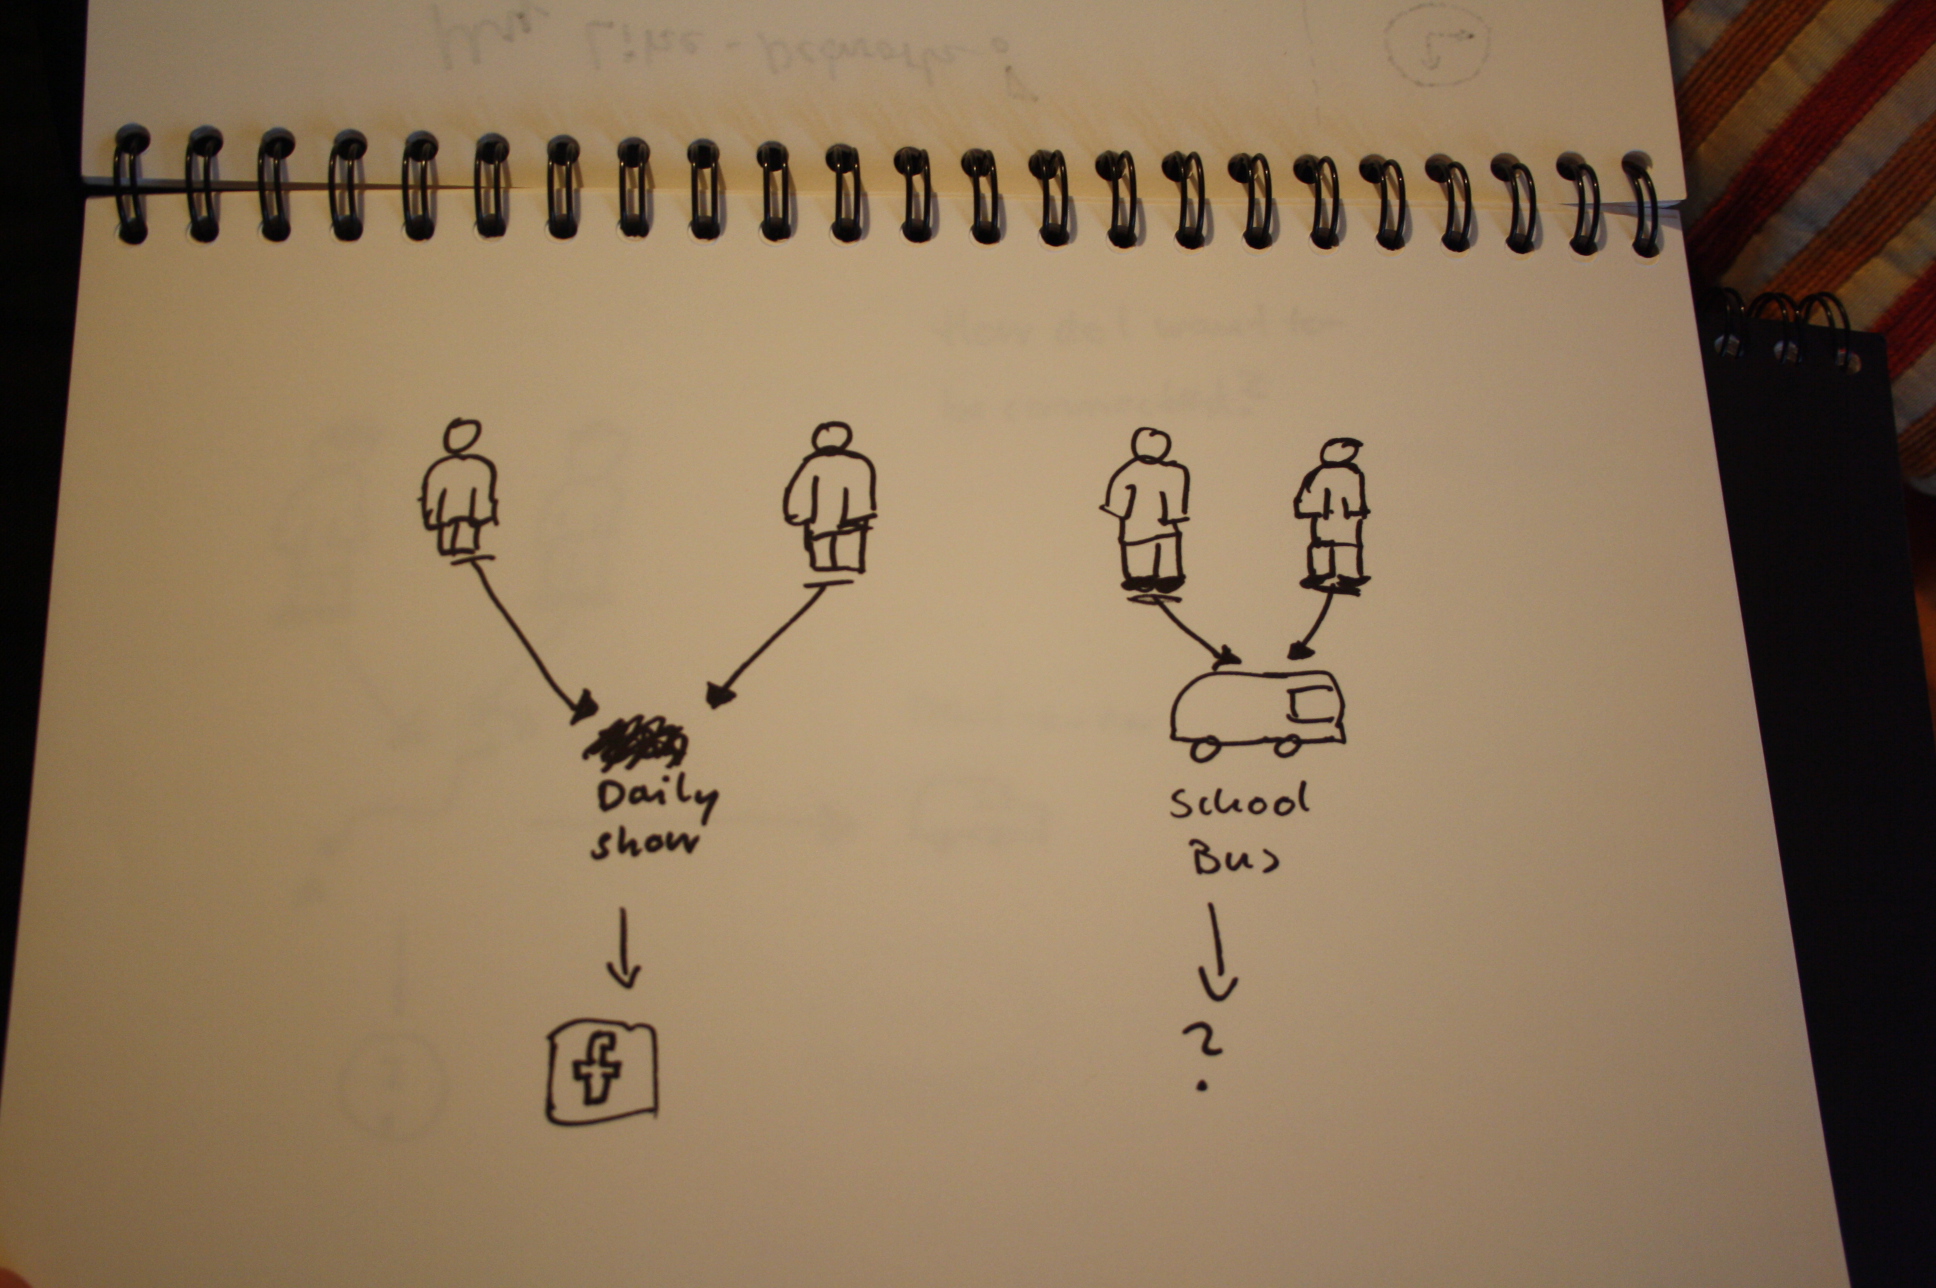

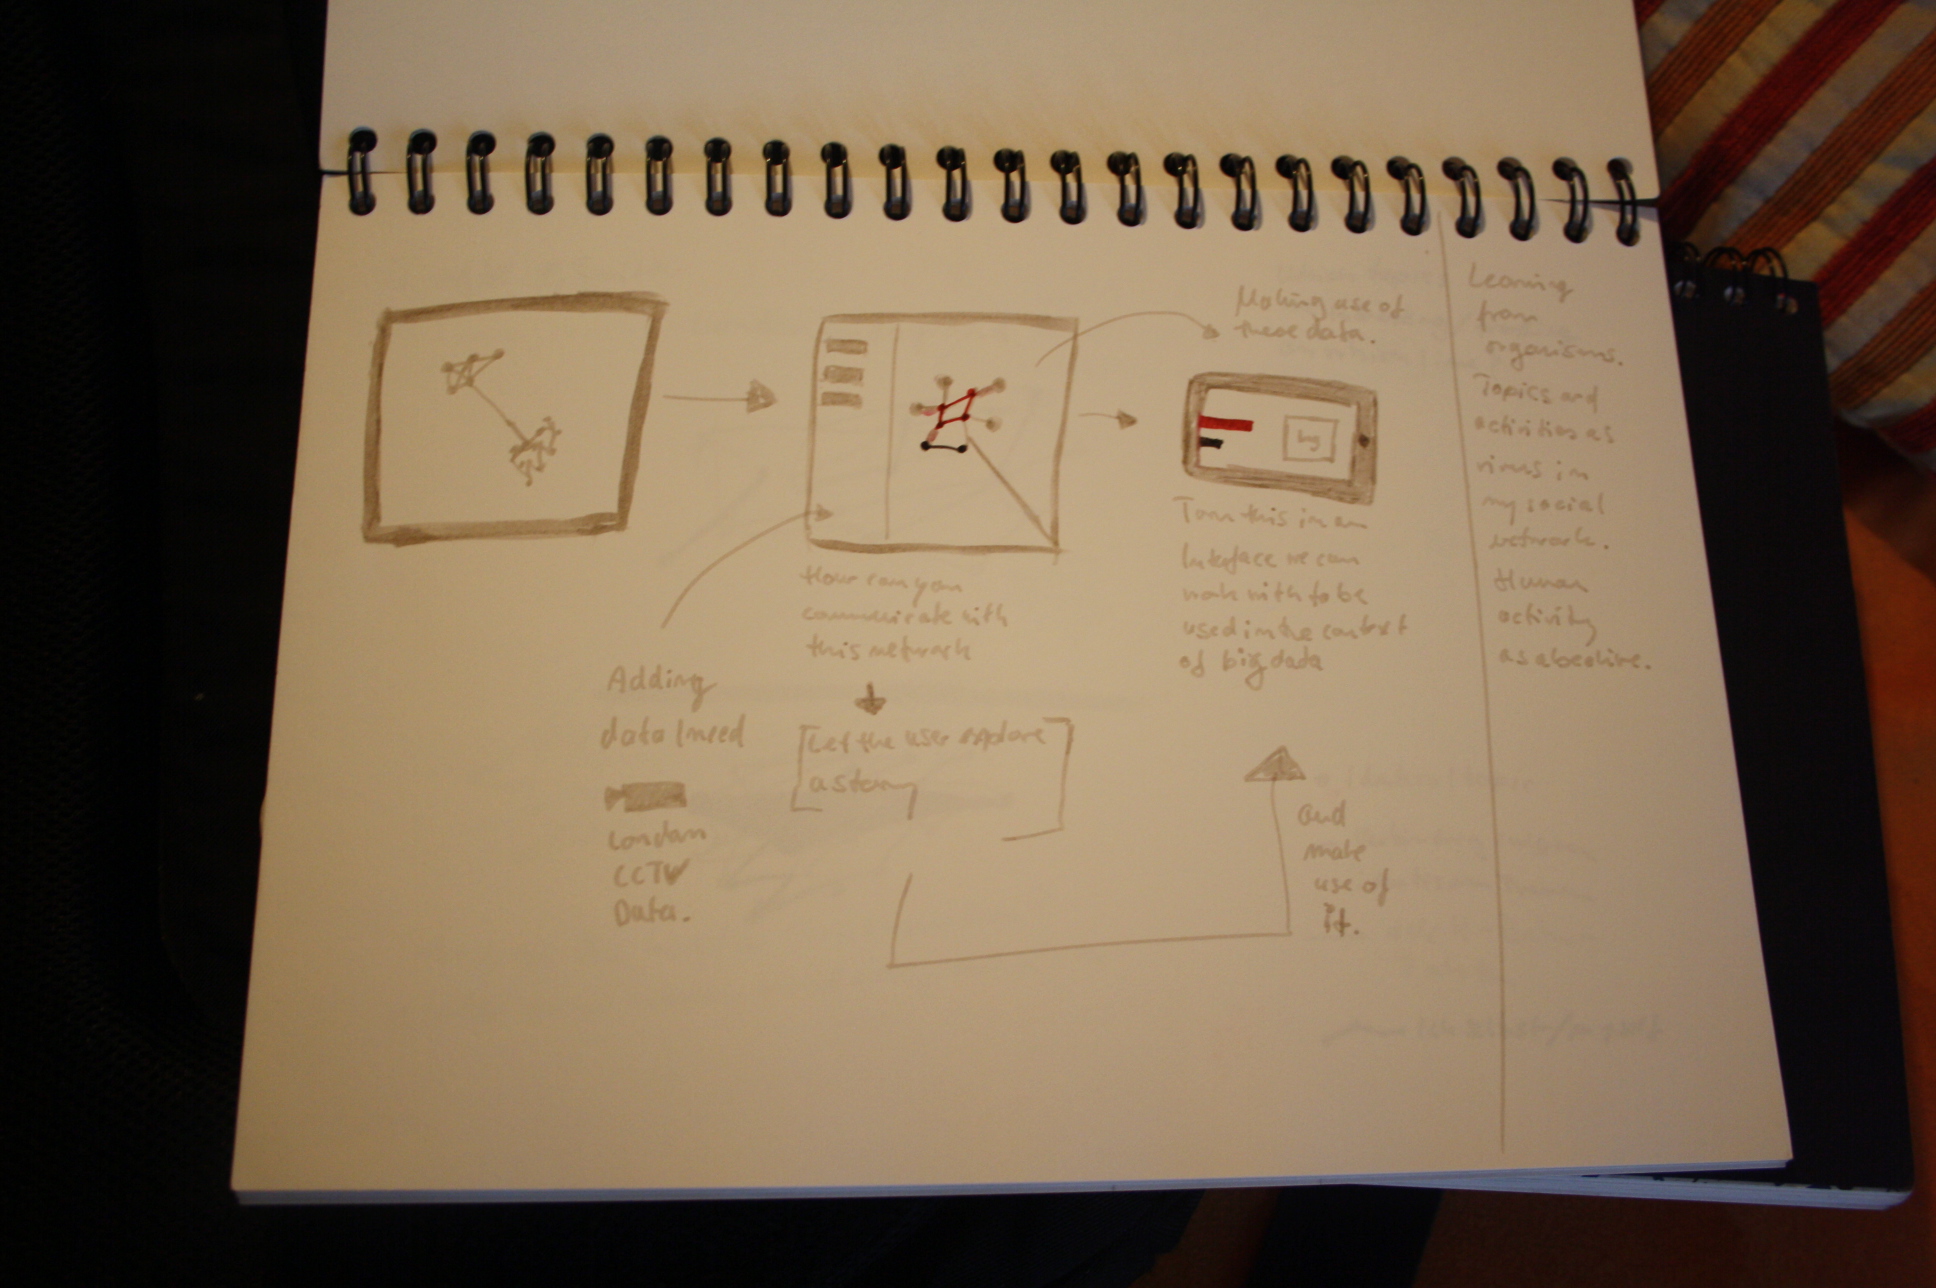
In the end I decided not to think about data stories but rather to enable users to make sense out of data themselves. So it was more about designing a process rather than designing specific solutions.
![]()
[Tool]
http://gephi.org
http://givememydata.com
[Links]
http://data.gov.uk/search/apachesolr_search?filters=tid%3A11542
http://appsandthecity.net
http://okfn.org/opendata
http://visual.ly/
[Books]
Klanten, R., Ehmann, S., Schulze, F. (2011). Visual Storytelling. Inspiring a New Visual Language. Berlin: Gestalten Verlag